S&P500 Trading Update 9/4/26

S&P500 Trading Update 9/4/26
***QUOTING ES1! FOR CASH US500 EQUIVALENT LEVELS, SUBTRACT POINT DIFFERENCE***
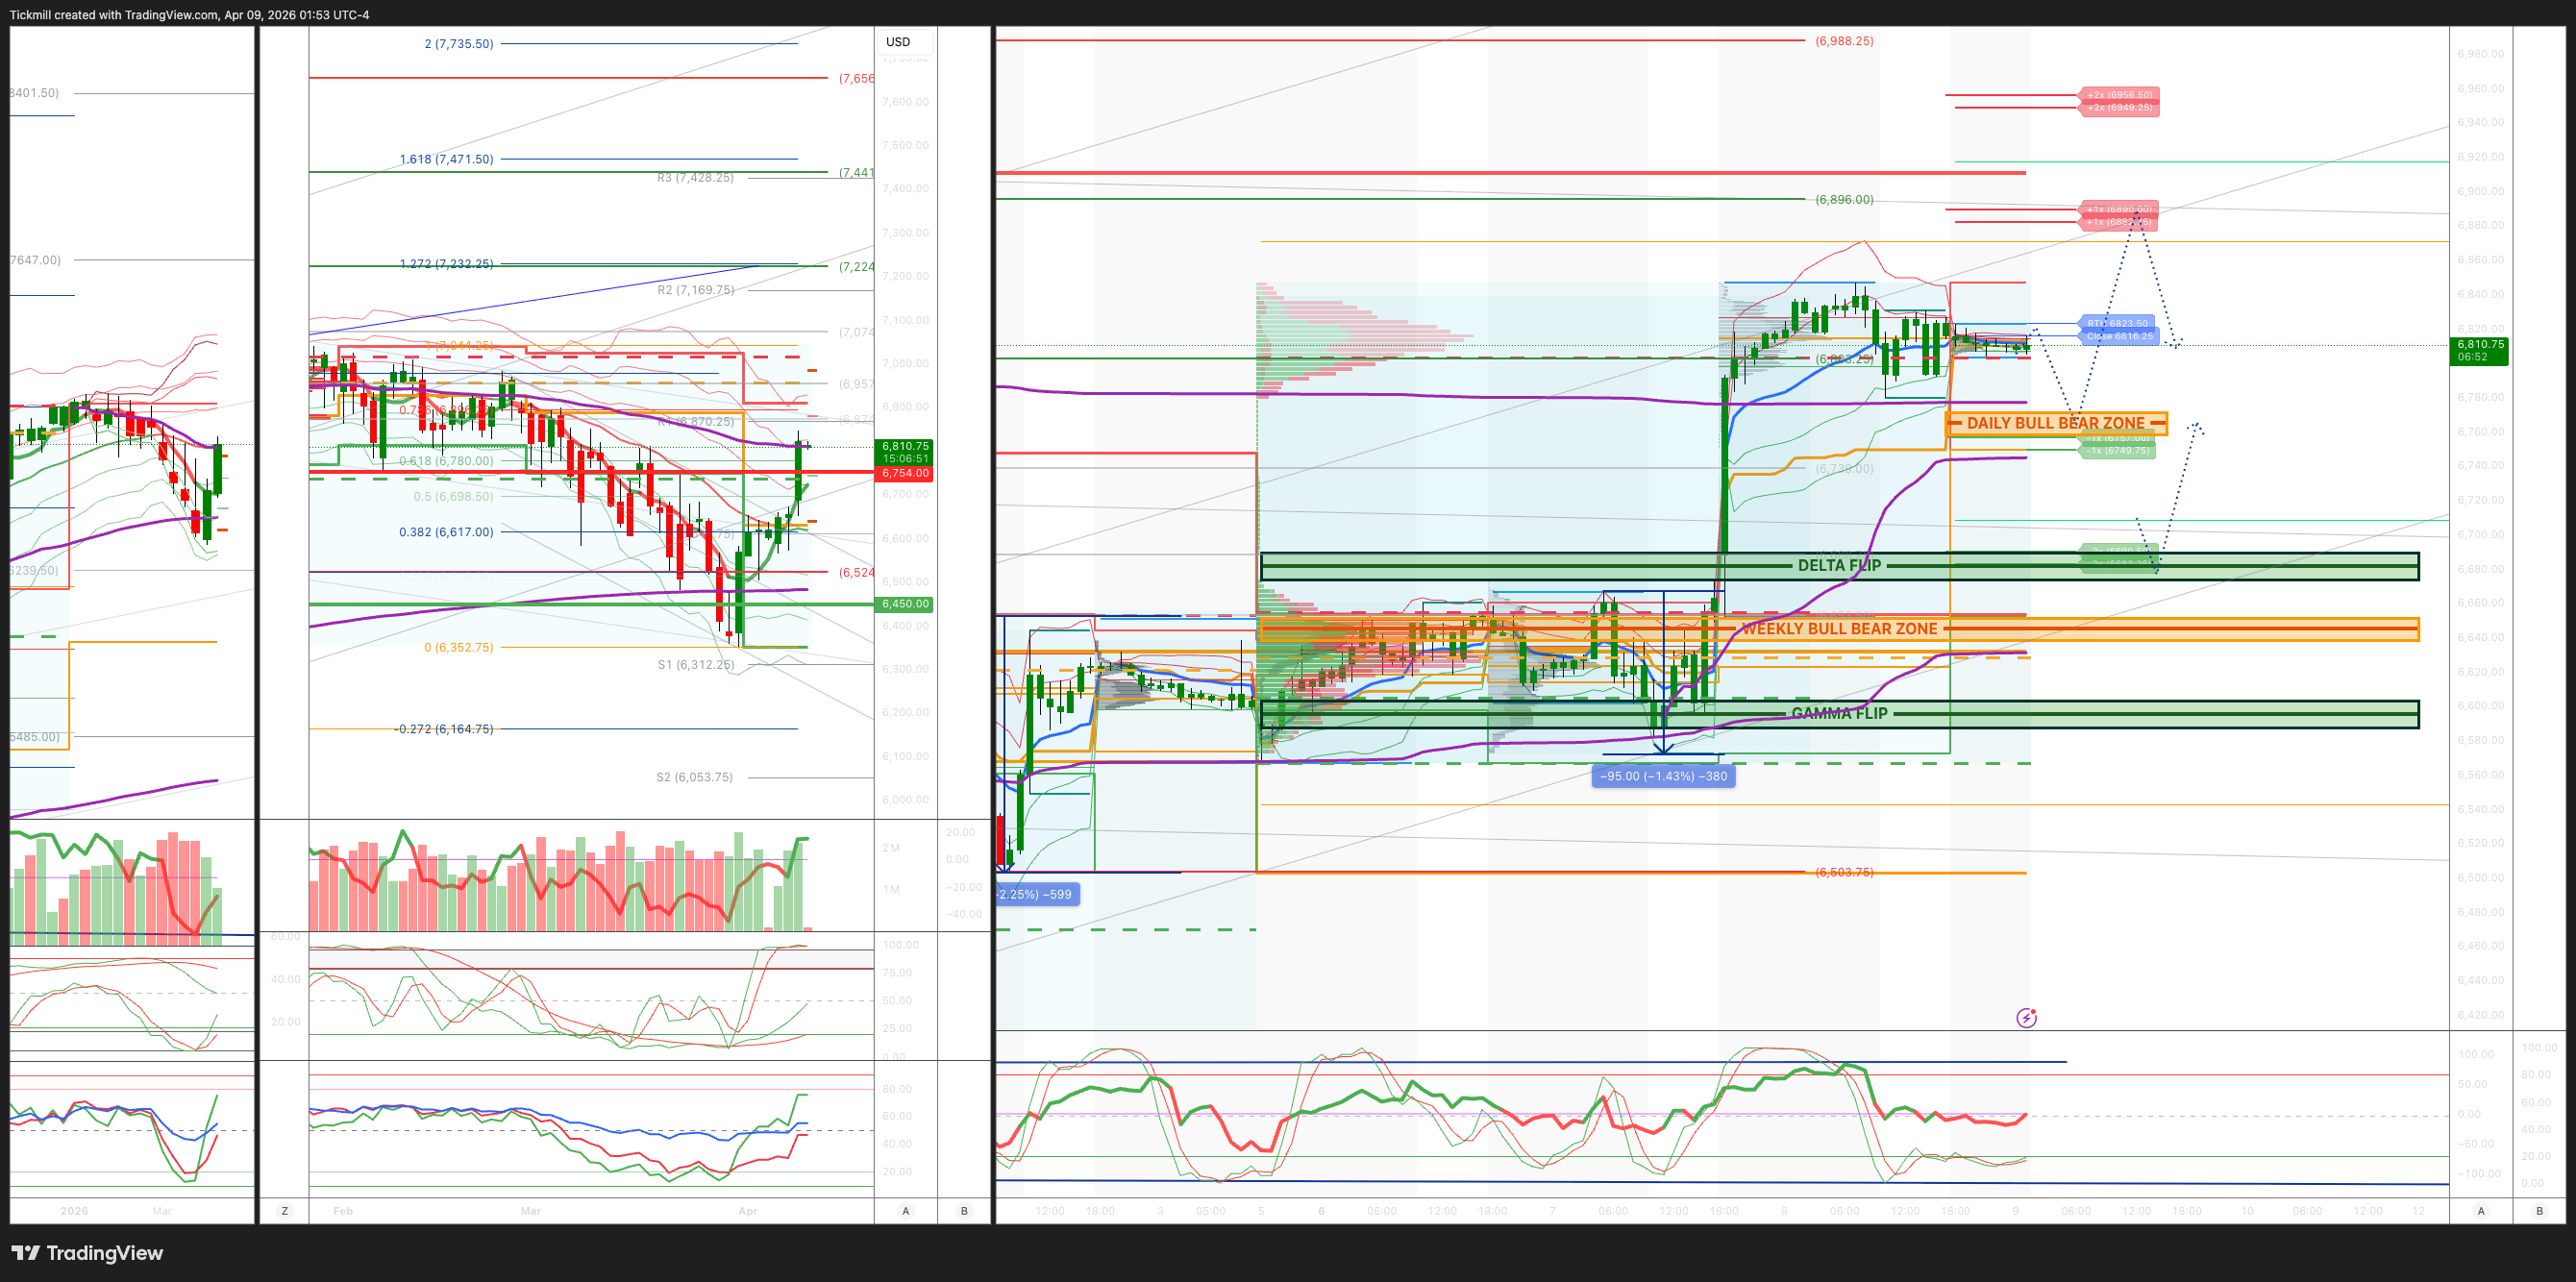
WEEKLY BULL BEAR ZONE 6640/50
WEEKLY RANGE RES 6754 SUP 6450
April OPEX Straddle: 328.55pt range implies a OPEX to OPEX range of [6177, 6835]
June QOPEX Straddle is 546.4pt giving us a range of [5960,7052]
JHEQX Q2 Collar 6189/6290 - 6865/6955
DEC2025 OPEX to DEC2026 OPEX is 945 points giving us a range of [5889,7779]
SPX PUT/CALL RATIO 1.48 (The numbers reflect options traded during the current session. A put-call ratio below 0.7 is generally considered bullish, and a put-call ratio above 1.0 is generally considered bearish)
DAILY VWAP BULLISH 6724
WEEKLY VWAP BULLISH 6591
MONTHLY VWAP BULLISH 6816
DAILY STRUCTURE – OTFH - 6780
WEEKLY STRUCTURE – BALANCE
MONTHLY STRUCTURE - OTFD - 6911
Balance: This refers to a market condition where prices move within a defined range, reflecting uncertainty as participants await further market-generated information. Our approach to balance includes favouring fade trades at the range extremes (highs/lows) while preparing for potential breakout scenarios if the balance shifts.
One-Time Framing Higher (OTFH): This represents a market trend where each successive bar forms a higher low, signalling a strong and consistent upward movement.
One-Time Framing Down (OTFD): This describes a market trend where each successive bar forms a lower high, indicating a pronounced and steady downward movement.
DAILY BULL BEAR ZONE 6780/70
GAMMA FLIP 6653
DAILY RANGE RES 6890 SUP 6757
2 SIGMA RES 6958 SUP 6690
VIX BULL BEAR ZONE 22
TRADES & TARGETS
LONG ON REJECT/RECLAIM OF DAILY BULL BEAR ZONE TARGET DAILY RANGE RES
***ADDITIONAL SETUPS & TARGETS HIGHLIGHTED ON THE CHARTS***
(I FADE TESTS OF 2 SIGMA LEVELS ESPECIALLY INTO THE FINAL HOUR OF THE NY CASH SESSION AS 90% OF THE TIME WHEN TESTED THE MARKET WILL CLOSE ABOVE OR BELOW THESE LEVELS)
GOLDMAN SACHS TRADING DESK VIEW - ‘Vigilant’
S&P 500 closed up 2.51% at 6,783, with a $3.8bn MOC imbalance to buy. The Nasdaq 100 gained 2.90% to 24,903, the Russell 2000 rose 2.97% to 2,620, and the Dow added 2.85% to 47,910. Total US equity volume reached 20.6bn shares, above the 19.5bn YTD daily average. The VIX fell 17.96% to 21.15, WTI crude declined 15.02% to $95.96, the US 10-year yield was unchanged at 4.30%, gold rose 0.46% to 4,728, the dollar index fell 0.87% to 98.99, and Bitcoin gained 3.07% to $71,436.
Overnight and into early trading, ETF flows on the desk were orderly but showed clear signs of covering in tech, semis, and Korea. Heading into the session, US macro product shorts were running at roughly 12% of total gross exposure, the highest level since Covid. Even so, the pace of covering was lighter than expected, as client conversations and early headlines suggested many investors were not convinced the two-week ceasefire meant markets were fully out of the woods.
Overall activity on the floor was described as a 5 out of 10. The floor finished 2.83% to buy versus a 30-day average of 1.04% to sell. Hedge funds were modest net sellers throughout the day, with an estimated 2% to 5% sell skew. ETF flows also turned more negative as re-shorting picked up into early afternoon, alongside supply in information technology, energy, and consumer discretionary. On the other hand, there were pockets of demand in materials, industrials, and rate-sensitive groups such as mortgage finance and homebuilders. Importantly, there was no broad-based short covering in single stocks, suggesting investors were hurt more by macro shorts than by single-name pair trades.
Long-only investors were active early, with buy flows concentrated in the Mag 7 and select semis, some of which appeared to carry over from prior sessions. Mega-cap tech looked like the cleanest way to add beta exposure, supported by stronger fundamentals, a favorable setup into earnings, and relatively clean positioning. Buying slowed as the market drifted lower through the day, reinforcing the sense that this group remains in wait-and-see mode, with demand likely at higher levels. Long-only accounts finished about 9.6% net to buy, down from roughly 20% buy skew earlier in the session, with demand in tech, healthcare, and financials, offset by supply in energy, ETFs, and staples.
The key thematic standout was the GS TMT Momentum Pair, which surged 10% for its best one-day move on record and closed at an all-time high. The market’s return to a risk-on backdrop drove investors back into old-regime winners such as memory, semicap, and optical, while pressuring old-regime losers including software and services. In the same vein, Software vs. Semis fell 8.5%, marking its worst one-day move on record. Desk flows reflected that shift, with a clear buy skew in mega-cap tech and semis, where investors appear most confident in the fundamentals heading into earnings. The next key question is what will be required to pull buyers further out along the conviction curve.
In derivatives, flows faded by midday and upside positioning was notably limited. The desk’s view is that investors are somewhat frozen by the size of the move and are unwilling to commit to staying positioned at these levels. Dealers are currently long gamma nearby but would flip short if the market moved roughly 1% higher. With the VIX now back to a 21 handle, a level not seen since the start of the Iran conflict, the implied move for the rest of the week in the S&P is around 1.09%.
After the close, STZ fell 3.7%. The print appeared broadly fine, with a modest revenue beat that was largely expected given stronger tracked channel data. The main issue seemed to be the lack of a positive organic outlook for 2027 and the pullback in 2028 guidance. Fourth-quarter EPS came in at $1.90 versus consensus of $1.71, a strong bottom-line beat, though EBIT was only about 1% ahead of expectations. Revenue was roughly 2% above consensus. Beer shipments rose 1%, versus a bogey closer to 2%, while beer depletions increased 0.6%. The company also withdrew its 2028 outlook, which it had provided last year. For 2027, it is now guiding to organic sales growth of -1% to +1%, with.
Disclaimer: The material provided is for information purposes only and should not be considered as investment advice. The views, information, or opinions expressed in the text belong solely to the author, and not to the author’s employer, organization, committee or other group or individual or company.
Past performance is not indicative of future results.
High Risk Warning: CFDs are complex instruments and come with a high risk of losing money rapidly due to leverage. 69% and 73% of retail investor accounts lose money when trading CFDs with Tickmill UK Ltd and Tickmill Europe Ltd respectively. You should consider whether you understand how CFDs work and whether you can afford to take the high risk of losing your money.
Futures and Options: Trading futures and options on margin carries a high degree of risk and may result in losses exceeding your initial investment. These products are not suitable for all investors. Ensure you fully understand the risks and take appropriate care to manage your risk.
Patrick has been involved in the financial markets for well over a decade as a self-educated professional trader and money manager. Flitting between the roles of market commentator, analyst and mentor, Patrick has improved the technical skills and psychological stance of literally hundreds of traders – coaching them to become savvy market operators!