S&P500 Trading Update 20/4/26

S&P500 Trading Update 20/4/26
***QUOTING ES1! FOR CASH US500 EQUIVALENT LEVELS, SUBTRACT POINT DIFFERENCE***
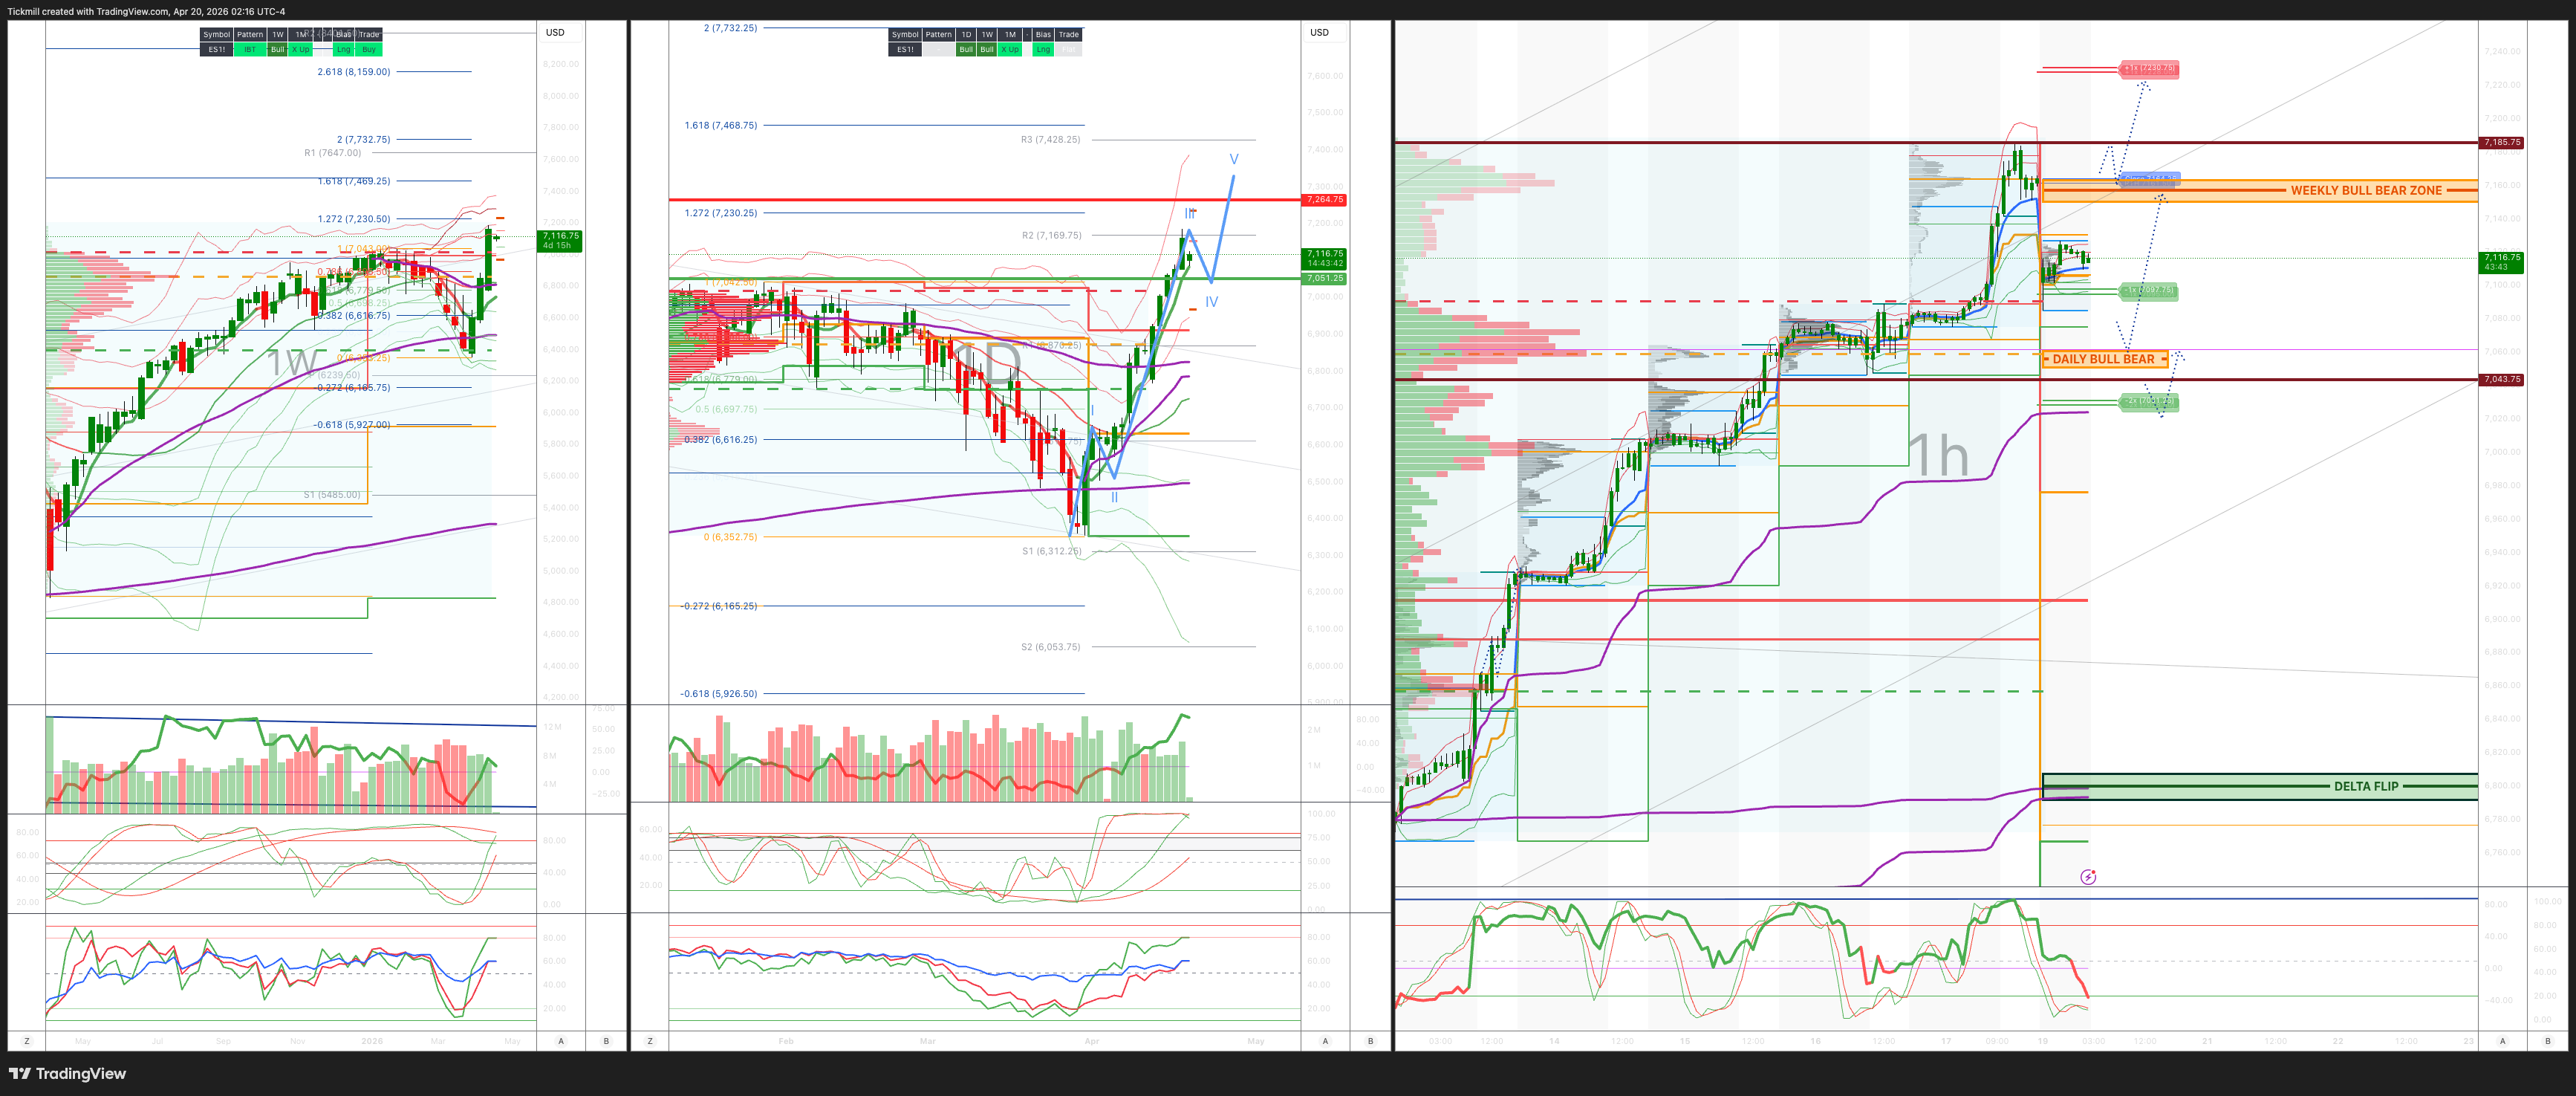
WEEKLY BULL BEAR ZONE 67150/60
WEEKLY RANGE RES 7262 SUP 7050
May OPEX Straddle: 225pt range implies a OPEX to OPEX range of [6900, 7350]
June QOPEX Straddle is 546.4pt giving us a range of [5960,7052]
JHEQX Q2 Collar 6189/6290 - 6865/6955
DEC2025 OPEX to DEC2026 OPEX is 945 points giving us a range of [5889,7779]
SPX PUT/CALL RATIO 0.93 (The numbers reflect options traded during the current session. A put-call ratio below 0.7 is generally considered bullish, and a put-call ratio above 1.0 is generally considered bearish)
DAILY VWAP BULLISH 7083
WEEKLY VWAP BULLISH 6825
MONTHLY VWAP BULLISH 6815
DAILY STRUCTURE – OTFH - 7111
WEEKLY STRUCTURE – OTFH - 6826
MONTHLY STRUCTURE - OTFD - BALANCE
Balance: This refers to a market condition where prices move within a defined range, reflecting uncertainty as participants await further market-generated information. Our approach to balance includes favouring fade trades at the range extremes (highs/lows) while preparing for potential breakout scenarios if the balance shifts.
One-Time Framing Higher (OTFH): This represents a market trend where each successive bar forms a higher low, signalling a strong and consistent upward movement.
One-Time Framing Down (OTFD): This describes a market trend where each successive bar forms a lower high, indicating a pronounced and steady downward movement.
DAILY BULL BEAR ZONE 7060/50
DELTA FLIP 6800
DAILY RANGE RES 7230 SUP 7095
2 SIGMA RES 7296 SUP 7029
VIX BULL BEAR ZONE 19.5
TRADES & TARGETS
LONG ON REJECT/RECLAIM OF DAILY BULL BEAR ZONE TARGET WEEKLY BULL BEAR ZONE
***ADDITIONAL SETUPS & TARGETS HIGHLIGHTED ON THE CHARTS***
(I FADE TESTS OF 2 SIGMA LEVELS ESPECIALLY INTO THE FINAL HOUR OF THE NY CASH SESSION AS 90% OF THE TIME WHEN TESTED THE MARKET WILL CLOSE ABOVE OR BELOW THESE LEVELS)
GOLDMAN SACHS TRADING DESK VIEW - ‘Colour On The Week’
ES ended the week at fresh all-time highs near 7,100, helped by a meaningful geopolitical de-escalation catalyst after Iran’s foreign minister said the Strait of Hormuz is completely open for commercial traffic for the duration of the ceasefire. That removed a major tail risk into the close and helped extend the squeeze. The next macro headline to watch is the expected US-Iran talks in Islamabad, with reports that Washington is considering a deal involving the release of $20bn in frozen Iranian funds in exchange for Iran giving up its stockpile of enriched uranium. For now, the market is treating this as a de-risking macro impulse, not a renewed threat.
Flow read: still supportive, but changing character
On desk color, the week finished with asset managers and hedge funds net buyers, driven by: macro covering
re-risking in tech and improving ECM tone, helped by three successful IPOs
The more important nuance is that hedge funds are transitioning from covering macro shorts to adding single-name longs. That is usually a healthier phase of the rally. It means the tape is no longer being driven only by index short-covering, but increasingly by bottom-up stock selection, especially in areas tied to the AI capex chain:
energy
industrials
hardware suppliers
names like LNG, ET, LGN, AMAT, MRVL
Outside AI, the main long interest is rotating toward healthcare, while there has also been notable covering and reshoring in software.
Long-only money remains a steady passive buyer, with continued concentration in supercap tech.
Systematic flows: still positive, but peak velocity likely behind us
CTA demand remains a tailwind:
currently long around $10bn of S&P
bought $33bn this week
expected to buy another $23bn next week
That is still supportive for the tape, but the key distinction is that the highest velocity of CTA demand is likely now behind us. So systematic buying is still helping, just not accelerating at the same pace as during the heart of the squeeze.
Prime read: more risk added, but not extreme
Prime brokerage data shows risk appetite rising further:
US L/S gross leverage: 213%, up 1.1 pts WoW
US L/S net leverage: 53.5%, up 1.9 pts WoW
US fundamental long/short ratio: 1.671, now in the 81st percentile of the past year
That says funds are adding risk, but this still does not look like a fully euphoric or maxed-out setup. It looks more like a market where managers are becoming more involved, though still selectively.
One subtle but important point: despite modest net selling in US equities this week, ETF shorts fell another 7.2%, and are now down 20.5% month-to-date, led by covers in:
Info Tech
Large Cap Equity
Credit ETFs
That is another sign the market has been lifted by short unwinds and de-hedging, even if outright long buying is only gradually taking over.
Sector flow highlights
Financials
Financials were net bought for the first time in 11 weeks, driven mostly by short covering and some long buying as earnings season kicked off. That is a meaningful flow shift and suggests investors are getting more comfortable broadening beyond mega-cap tech.
Industrials
Industrials were the most net sold sector this week, even though price action held up reasonably well. Nearly all subsectors saw selling. That likely reflects profit-taking and de-risking after a strong run rather than a clean bearish call, but it does make Industrials more important to watch on earnings.
TMT
Tech had another very strong week, with software outperforming sharply, especially after last week’s washout. Moves in names like MSFT and ORCL created visible discomfort. But early prints from ASML, TSM, and NFLX traded weaker after earnings, which suggests expectations are elevated and the bar remains high.
Energy
In energy, the market focused on de-escalation, which pressured the more crowded and better-owned energy groups. But the specialist debate continues to center on whether this is now a dip to buy, especially with:
valuations more compelling
physical markets still tight
2Q / 3Q revisions still screening well
Consumer
Consumer feedback remains mixed. Corporate commentary has sounded more cautious, and staples may see a slower EPS setup. But after lagging the rally, investors finally started to play catch-up in consumer on Friday following the Iran headline.
Earnings and macro this week
The week ahead is busy, with around 24% of S&P market cap reporting, making it the second busiest week of Q1 earnings season. The reporting mix is tilted toward:
Communication Services
Energy
Industrials
The key macro events to watch:
Retail Sales on Tuesday
Warsh Senate confirmation hearing on Tuesday
the Fed blackout period continues ahead of the April 29 rate decision
The S&P implied move through Friday is 1.39%, which suggests the options market still expects a relatively controlled week, especially compared with the scale of the recent move.
Disclaimer: The material provided is for information purposes only and should not be considered as investment advice. The views, information, or opinions expressed in the text belong solely to the author, and not to the author’s employer, organization, committee or other group or individual or company.
Past performance is not indicative of future results.
High Risk Warning: CFDs are complex instruments and come with a high risk of losing money rapidly due to leverage. 69% and 73% of retail investor accounts lose money when trading CFDs with Tickmill UK Ltd and Tickmill Europe Ltd respectively. You should consider whether you understand how CFDs work and whether you can afford to take the high risk of losing your money.
Futures and Options: Trading futures and options on margin carries a high degree of risk and may result in losses exceeding your initial investment. These products are not suitable for all investors. Ensure you fully understand the risks and take appropriate care to manage your risk.
Patrick has been involved in the financial markets for well over a decade as a self-educated professional trader and money manager. Flitting between the roles of market commentator, analyst and mentor, Patrick has improved the technical skills and psychological stance of literally hundreds of traders – coaching them to become savvy market operators!