SP500 LDN TRADING UPDATE 20/6/25
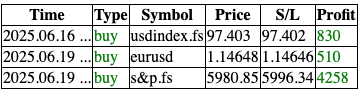
SP500 LDN TRADING UPDATE 20/6/25
WEEKLY & DAILY LEVELS
***QUOTING ES1! CASH US500 EQUIVALENT LEVELS SUBTRACT ~50 POINTS***
WEEKLY ACTION AREA & PRICE TARGET VIDEO - https://www.youtube.com/watch?v=JGai0yB4XYE&t=218s
WEEKLY BULL BEAR ZONE 6090/6100
WEEKLY RANGE RES 6150 SUP 5914
DAILY BULL BEAR ZONE 6050/40
DAILY RANGE RES 6094 SUP 5975
2 SIGMA RES 6153 SUP 5918
GAP LEVELS 5843/5741/5710 - 5979 (ESM25 CONTRACT GAP)
VIX BULL BEAR ZONE 21
DAILY MARKET CONDITION -ONE TIME FRAMING DOWN - 6073
One-Time Framing Down: This describes a market trend where each successive bar forms a lower high, indicating a pronounced and steady downward movement.
TRADES & TARGETS
SHORT ON TEST/REJECT DAILY BULL BEAR ZONE TARGET DAILY RANGE SUP
LONG ON ACCEPTANCE ABOVE DAILY BULL BEAR ZONE TARGET DAILY RANGE RES
(I FADE TESTS OF 2 SIGMA LEVELS ESPECIALLY INTO THE FINAL HOUR OF THE NY CASH SESSION AS 90% OF THE TIME WHEN TESTED THE MARKET WILL CLOSE AT OR BELOW THESE LEVELS)
GOLDMAN SACHS TRADING DESK VIEWS
US EQUITIES
Observations into Month-End
FICC and Equities | 19 June 2025 | 9:18 AM UTC
Key Highlights:
- S&P Gamma: Current estimates suggest approximately $15 billion of gamma in the market, with a notable concentration on strikes slightly below the market's present level.
- The chart below effectively illustrates the shape of the S&P dealer gamma curve. Dealers tend to get longer during selloffs and less long during rallies, though the magnitude is relatively smaller. Our model likely underestimates the extent of dealer long gamma driven by OTC products that provide dealers with short-dated optionality.
- This dynamic is expected to shift post month-end, primarily due to:
1. The rolling of significant quarterly listed positions.
2. The re-striking of overwriting products, which will then move above spot.
Quarter-End Estimates: Our models indicate that pensions are set to sell approximately $20 billion in U.S. equities, placing this estimate in the 90th percentile for absolute dollar value among buy and sell estimates over the past three years, and in the 7th percentile on a net basis. The model emphasizes quarterly dynamics over monthly, which may result in an overestimation of flow projections. Additionally, we anticipate a delta of about $10 billion to be bought at quarter-end, contingent on the SPX trading above 5905 on the last day of the month, potentially offsetting much of the pension-related selling.
Buybacks: Our corporate desk estimates that the blackout period began on Monday, with roughly 40% of companies currently in blackout, expected to end around July 25. Typically, blackout periods start approximately 4-6 weeks before earnings announcements and conclude 1-2 days after earnings.
Systematics: Currently, there is a long position of $126 billion in U.S. equities. However, CTAs are projected to become minor sellers over the next week, with an estimated $310 million in sales if the market remains flat. In an upward market trend, demand could increase, with potential purchases of $790 million over a week and $7.59 billion over a month, primarily driven by demand for Russell ($3.46 billion) and S&P ($3.41 billion). Overall positioning has stayed relatively stable, but we anticipate funds will continue to re-leverage if the SPX 3-month realized volatility decreases.
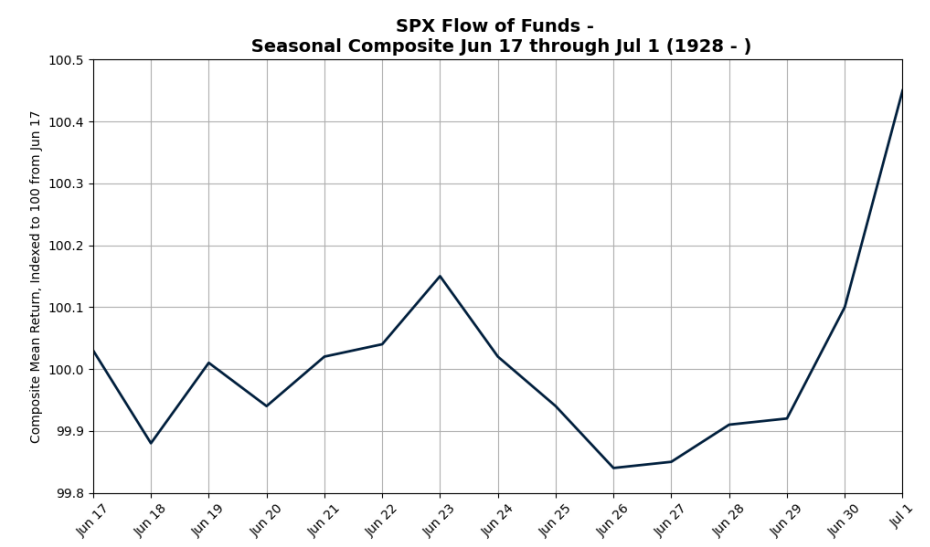
Seasonality: Historically, the latter half of June has been positive for the S&P, yielding an average return of 45 basis points from June 17 to July 1, based on data from 1928 to the present. While the upcoming week may show minimal negative returns, there has typically been a rally in the days leading up to July.
VIX ETN vega is on the rise again. UVIX, the 2x leveraged VIX ETF, has experienced a more than fivefold increase in its AUM over the past couple of months. This development is significant because the product functions as short gamma within the VIX futures complex. Consequently, VIX puts hold value not only as a strategy to counteract the substantial net vega buying but also as a way to capitalize on higher realized volatility of volatility (VIX vol). This is driven by the behavior of leveraged products, which sell volatility when it declines and buy volatility when it rises.
Disclaimer: The material provided is for information purposes only and should not be considered as investment advice. The views, information, or opinions expressed in the text belong solely to the author, and not to the author’s employer, organization, committee or other group or individual or company.
Past performance is not indicative of future results.
High Risk Warning: CFDs are complex instruments and come with a high risk of losing money rapidly due to leverage. 69% and 73% of retail investor accounts lose money when trading CFDs with Tickmill UK Ltd and Tickmill Europe Ltd respectively. You should consider whether you understand how CFDs work and whether you can afford to take the high risk of losing your money.
Futures and Options: Trading futures and options on margin carries a high degree of risk and may result in losses exceeding your initial investment. These products are not suitable for all investors. Ensure you fully understand the risks and take appropriate care to manage your risk.
Patrick has been involved in the financial markets for well over a decade as a self-educated professional trader and money manager. Flitting between the roles of market commentator, analyst and mentor, Patrick has improved the technical skills and psychological stance of literally hundreds of traders – coaching them to become savvy market operators!