S&P500 Daily Action Areas & Price Targets 4/8/26

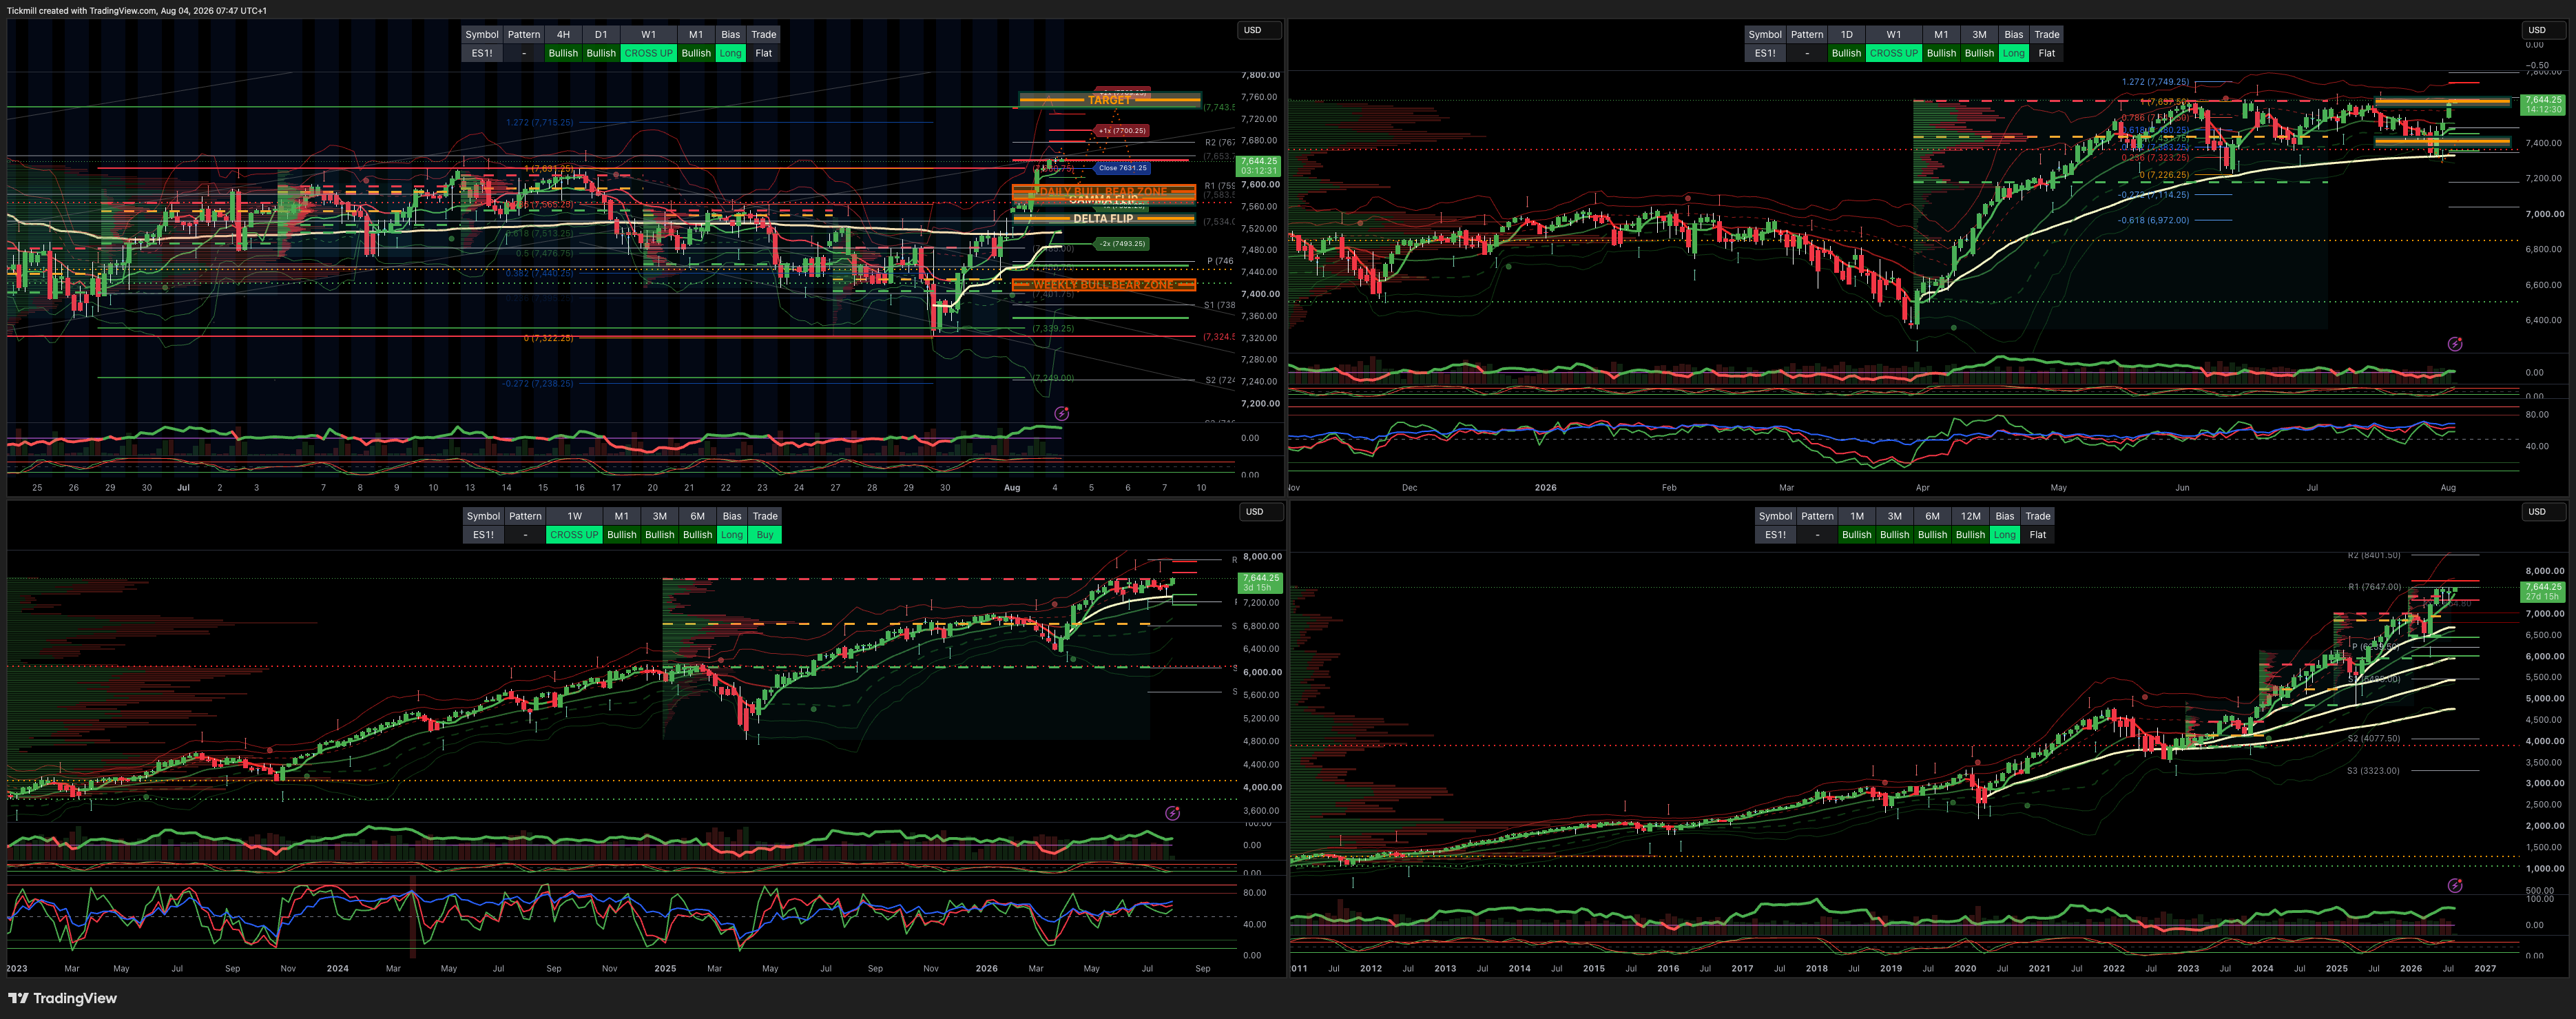
S&P500 Daily Action Areas & Price Targets 4/8/26
***QUOTING ES1! FOR CASH US500 EQUIVALENT LEVELS, SUBTRACT POINT DIFFERENCE***
WEEKLY BULL BEAR ZONE 7400/20
WEEKLY RANGE RES 7635 SUP 7410
MONTHLY RANGE RES 7838 SUP 7258
JHEQX Q3 Collar Short Call Cap: ~7,750 – 7,900 - Long Put Strike: ~7,050 – 7,100 (approx. 5% downside protection) Short Put Strike: ~5,950
DEC2025 OPEX to DEC2026 OPEX is 945 points giving us a range of [5889,7779]
SPX PUT/CALL RATIO 0.9 (The numbers reflect options traded during the current session.) A put-call ratio below 0.7 is generally considered bullish, and a put-call ratio above 1.0 is generally considered bearish.
GS Flow Desk: large S&P 31Aug 7000/7950 strangle in roughly $20mm vega / $115mm premium …My Read – classic “big convexity versus carry” trade: either someone paid a lot to own a wide August move, or someone got paid a lot to bet that the S&P stays comfortably inside the 7000–7950 corridor
DAILY VWAP BULLISH 7480
WEEKLY VWAP BEARISH>BULLISH 7522
MONTHLY VWAP BULLISH 7477
DAILY STRUCTURE - OTFH - 7542
WEEKLY STRUCTURE - BALANCE 7648/7247
MONTHLY STRUCTURE - OTFH - 7247
Balance: This refers to a market condition where prices move within a defined range, reflecting uncertainty as participants await further market-generated information. Our approach to balance includes favouring fade trades at the range extremes (highs/lows) while preparing for potential breakout scenarios if the balance shifts.
One-Time Framing Higher (OTFH): This represents a market trend where each successive bar forms a higher low, signalling a strong and consistent upward movement.
One-Time Framing Lower (OTFL): This describes a market trend where each successive bar forms a lower high, indicating a pronounced and steady downward movement.
DAILY BULL BEAR ZONE 7600/590
GAMMA FLIP 7570
DELTA FLIP 7528
DAILY RANGE RES 7700 SUP 7560
2 SIGMA RES 7767 SUP 7493
VIX BULL BEAR ZONE 17.9 (VVIX / VIX) 5.72
TRADES & TARGETS
LONG ON REJECT/RECLAIM DAILY BEAR ZONE TARGET DAILY RANGE RES > AUG MOPEX RES 7720
***ADDITIONAL SETUPS & TARGETS HIGHLIGHTED ON THE CHARTS***
(I FADE TESTS OF 2 SIGMA LEVELS ESPECIALLY INTO THE FINAL HOUR OF THE NY CASH SESSION AS 90% OF THE TIME WHEN TESTED THE MARKET WILL CLOSE ABOVE OR BELOW THESE LEVELS)
GOLDMAN SACHS FICC & EQUITY TRADING DESK VIEWS
Tech / AI Deleveraging, Not Yet a Broad Risk-Off Event
Goldman’s latest GOAL positioning update reinforces the broader market message: the recent stress has been driven mainly by a momentum-led deleveraging in Tech / AI / semiconductors, rather than a full broad-based de-risking across assets.
The important distinction is:
This is not yet a generalized liquidation. It is a concentrated unwind in the most crowded, leveraged, AI-linked parts of the equity market.
That said, the risk is that elevated single-stock volatility, reduced retail leverage, fading VIX carry, and more bearish fast-moving indicators could turn a concentrated factor unwind into a broader correlation event if macro pressure intensifies.
1. Sentiment Has Deteriorated, but Risk Appetite Is Still Elevated
Goldman’s sentiment and positioning indicator has turned more negative and is now around the 53rd percentile. That is weaker than before, but not capitulation territory.
At the same time, the GS Risk Appetite Indicator remains elevated at around 0.8.
This means the market has de-risked at the margin, but investors are not broadly bearish yet.
Indicator | Current Message |
|---|---|
GS sentiment / positioning indicator | More negative, around 53rd percentile |
GS Risk Appetite Indicator | Still elevated, around 0.8 |
Equity flows | Resilient |
Fixed income flows | Dominant YTD, especially in relative terms |
Fast-moving indicators | More bearish |
Hedge fund leverage | Meaningfully reduced |
The broader implication is that positioning is less stretched than before, but not washed out across all assets.
2. The Unwind Is Concentrated in AI / Tech Momentum
Goldman emphasizes that investor activity has been dominated by a momentum unwind in AI-related trades.
According to GS Prime Brokerage data:
Global Info Tech stocks saw the largest long selling since January 2021
It was the second-largest two-day long selling episode of the past decade
The re-risking before the unwind had been fast and highly concentrated around the AI trade
Participation was increasingly expressed through leveraged / short-dated instruments
This matches the broader flow picture from prior notes:
Record de-grossing
Momentum factor capitulation
AI / semiconductor crowding unwind
Mega-cap Tech and broad AI exposure reduced to YTD lows
Factor vol at post-COVID highs while index vol remains comparatively contained
The key conclusion: the pain has been under the index surface.
3. Dispersion Is Extremely High: Single-Stock Vol Up, Index Correlation Anchored
One of the most important points in the note is the dispersion setup.
Goldman notes that optimism around a small number of AI capex / semiconductor stocks created unusually high market dispersion. Average single-stock implied volatility has risen to its highest level since 2020, while index implied correlation remains anchored at low levels.
That means:
Single names are moving violently.
Index volatility has not fully reflected the stress.
The market is still treating the unwind as idiosyncratic / thematic rather than systemic.
Dispersion remains elevated.
This is the same setup that supports interest in reverse dispersion if investors think a macro / correlation event is becoming more likely.
The risk transmission is:
High Single-Stock Vol+Low Index Correlation→Crowded Dispersion→Risk of Corr1 ShockHigh Single-Stock Vol+Low Index Correlation→Crowded Dispersion→Risk of Corr1 Shock
If correlations rise, index vol can catch up quickly.
4. Retail Leverage Is Starting to Moderate
Retail leverage had reached extreme levels, particularly in developed-market Asia, and is now starting to reverse.
South Korea
Margin balances surged to record highs in Korean equities before starting to fall. Given Korea’s heavy AI / semiconductor exposure, this is important because retail leverage has been a major amplifier of the AI hardware trade.
Japan
Japan saw a similar pattern. Margin-financed equity purchases reached their highest level since 1990 before moderating.
US
US retail investors have also moderated purchases of semiconductor stocks after very strong inflows earlier this year.
Leveraged ETFs
Assets in leveraged ETFs exposed to Tech, including South Korea and Taiwan, have retraced after a sharp build-up in previous weeks.
The message is clear: retail is no longer adding the same impulse to Tech / AI momentum that it did earlier in the year.
5. Leveraged Funds Are Reducing Short VIX Exposure
Goldman notes that leveraged funds have reduced their short VIX futures exposure, similar to prior VIX carry unwind episodes:
2018 Volmageddon
2024–25 VIX carry unwinds
This does not mean another Volmageddon is inevitable. But it does show that vol-selling / carry positioning has become more defensive.
The relevance is that short-vol positioning had been one of the key suppressors of index volatility. If leveraged funds reduce short VIX exposure, it can remove a stabilizing force and make index vol more responsive to shocks.
However, the important nuance is that this reduction may also reduce the risk of a disorderly short-vol squeeze later. In other words, some of the vulnerability has already been cleaned up.
6. Equity-Linked Debt Issuance Remains Resilient
Despite the unwind in Tech / AI positioning, equity-linked debt issuance has remained resilient. Goldman specifically highlights that global Tech convertible issuance was particularly strong during the second quarter.
This matters because it shows that financing markets have not closed. Companies are still able to issue equity-linked debt, and investors are still willing to absorb it.
That is inconsistent with a full-blown risk-off regime.
The message:
Equity momentum has cracked.
But capital markets are still functioning.
Credit / convert demand remains healthier than equity factor price action alone would imply.
7. Hedge Funds Have Deleveraged Meaningfully
Hedge fund de-risking is real.
Goldman notes:
Gross leverage has reversed half of the yearly increase.
Net leverage is now down on the year.
Hedge funds have reduced exposure meaningfully.
This aligns with the earlier GS Prime data showing a historic de-grossing episode.
But the nuance is important. The de-risking has not been evenly distributed. It has been concentrated in:
Global Info Tech
AI-related trades
Semiconductors
Mega-cap Tech
Momentum
Leveraged thematic longs
So positioning is cleaner in the problem areas, but broad risk appetite is not fully reset.
8. Active Managers and Surveys Are Less Optimistic
Fast-moving positioning indicators have shifted more bearish.
Goldman highlights:
US equity futures positioning remains elevated but no longer extreme.
Call / put ratios have declined.
Investor surveys have turned less optimistic.
Active manager positioning has pulled back modestly.
The NAAIM Index is now 79.7, still relatively high but off prior levels.
This suggests active managers have not capitulated. They have reduced risk, but remain reasonably constructive.
That matters for market risk. If the tape deteriorates further, there is still room for additional de-risking from active managers.
9. Cross-Asset Positioning: Fed, USD, Treasuries, JPY
Outside equities, Goldman says the largest positioning shifts reflect policy repricing after central bank meetings and FX interventions.
USD
USD net speculative futures positioning increased sharply.
This matches JPM’s view that the long-dollar trade remains alive despite the post-FOMC credibility-driven selloff. Investors still see USD support from:
Carry
Solid data
Potential future Fed hikes
Energy / geopolitical risk
Safe-haven demand
Long-Dated Treasuries
Long-dated Treasury ETF put-call skew rose sharply after the FOMC. That signals increased demand for protection against higher long-end yields / lower long-duration bond prices.
This fits the post-FOMC curve narrative:
Long end repriced higher
2s30s twist steepened
Fed credibility concerns rose
Inflation risk premium increased
JPY
JPY risk reversals rebounded sharply into recent FX intervention. However, net non-commercial futures positioning remains negative.
That implies options markets are becoming more sensitive to upside JPY risk, but speculative positioning has not fully turned bullish yet.
10. How This Fits the Broader Market Narrative
Goldman’s positioning update fits neatly into the current tactical framework:
What Has Improved
AI / Tech positioning is cleaner.
Hedge funds have deleveraged meaningfully.
Short VIX exposure has been reduced.
Futures positioning is no longer at extremes.
Retail leverage is moderating.
Some crowded momentum exposure has been flushed.
What Remains Fragile
Risk appetite is still elevated.
NAAIM remains fairly high at 79.7.
Single-stock implied vol is at the highest level since 2020.
Index implied correlation remains low.
August liquidity is poor.
Systematic flow risk is downside-skewed.
Fed credibility / long-end rate volatility remains unresolved.
Retail / passive flow support may fade into August.
A Corr1 event would pressure index vol higher.
The market is cleaner, but not necessarily safe.
11. Tactical Implications
Equities
The unwind is mature enough to justify selective dip-buying, but not broad beta chasing.
Preferred areas remain:
AI hardware
Datacenters
Semis
Asia AI bottlenecks
Profitable hyperscalers over non-profitable tech
Electricity / power beneficiaries
Avoid chasing:
High-beta momentum broadly
Crowded retail favorites
Non-profitable tech
Structural AI losers that only bounced because shorts squeezed
Volatility
The vol setup argues for caution.
Single-stock vol is already elevated, while index correlation remains low. This favors:
Limited-loss upside expressions
Reverse dispersion if correlation risk is rising
Index hedges around macro events
Avoiding naked short vol in crowded themes
Rates / FX
The cross-asset positioning update reinforces the importance of:
Long-end Treasury volatility
USD speculative positioning
Fed credibility risk
JPY intervention risk
Gold as a debasement / credibility barometer
Disclaimer: The material provided is for information purposes only and should not be considered as investment advice. The views, information, or opinions expressed in the text belong solely to the author, and not to the author’s employer, organization, committee or other group or individual or company.
Past performance is not indicative of future results.
High Risk Warning: CFDs are complex instruments and come with a high risk of losing money rapidly due to leverage. 69% and 73% of retail investor accounts lose money when trading CFDs with Tickmill UK Ltd and Tickmill Europe Ltd respectively. You should consider whether you understand how CFDs work and whether you can afford to take the high risk of losing your money.
Futures and Options: Trading futures and options on margin carries a high degree of risk and may result in losses exceeding your initial investment. These products are not suitable for all investors. Ensure you fully understand the risks and take appropriate care to manage your risk.
Patrick has been involved in the financial markets for well over a decade as a self-educated professional trader and money manager. Flitting between the roles of market commentator, analyst and mentor, Patrick has improved the technical skills and psychological stance of literally hundreds of traders – coaching them to become savvy market operators!