Institutional Insights: Goldman Sachs - Seasonal Pickup in Volatility
.jpeg)
According to historical trends, we anticipate an uptick in global equity volatility during October. We believe that purchasing equity volatility will yield profits in the coming weeks, with a preference for short-dated options related to specific events and a reluctance to invest in volatility on non-event days. Our findings reveal that equity volatility on event days has increased, while it has decreased on non-event days. Last quarter, the movements of single stocks around earnings events reached their highest levels since 2009, even though the SPX had a 3-month realized volatility of just 9. Event-driven volatility may further rise as the October earnings season usually brings about heightened volatility. On a broader scale, FOMC meetings, Federal Reserve statements, and CPI data are under scrutiny as investors gauge the pace of the ongoing rate-cutting cycle. This report highlights over 450 single-stock non-earnings catalysts that could potentially boost volatility in the US, Europe, and Asia. Historically, SPX realized volatility has climbed by 26% from August to October on average over the past 96 years. While some attribute major market corrections to happenstance in October, we believe that pressures on company management to fulfill year-end expectations and on investors concerning their annual performance catalysts heighten shifts in market sentiment during this time. Notably, trading volumes for shares and single stock options have averaged a peak in October over the past 29 years.
We predict that the rise in volatility will be widespread but recommend capitalizing on this through single-stock options. In this report, we provide historical insights into index volatility across the US, Europe, and Asia (Exhibits 1-10), as well as trends related to single-stock volatility. With the S&P 500's one-month average stock implied volatility at the 33rd percentile over the past year, we encourage investors to consider long option strategies in anticipation of a probable increase in volatility in the month ahead. Over the last 29 years, stock volatility has notably centered around earnings events, where October earnings reports typically feature the most significant price movements of the year (Exhibits 13-20). We consulted with analysts in the equity research department to identify 291 non-earnings events in the US, 166 in Europe, and 18 in Asia set to occur before the end of the year (Exhibits 21-27). We view each of these events as potential opportunities to purchase volatility, including 142 analyst meetings where company management is likely to provide guidance updates for the following year. Although we expect October’s earnings reports to be significant volatility drivers, we have not included them since their schedules are well-known.
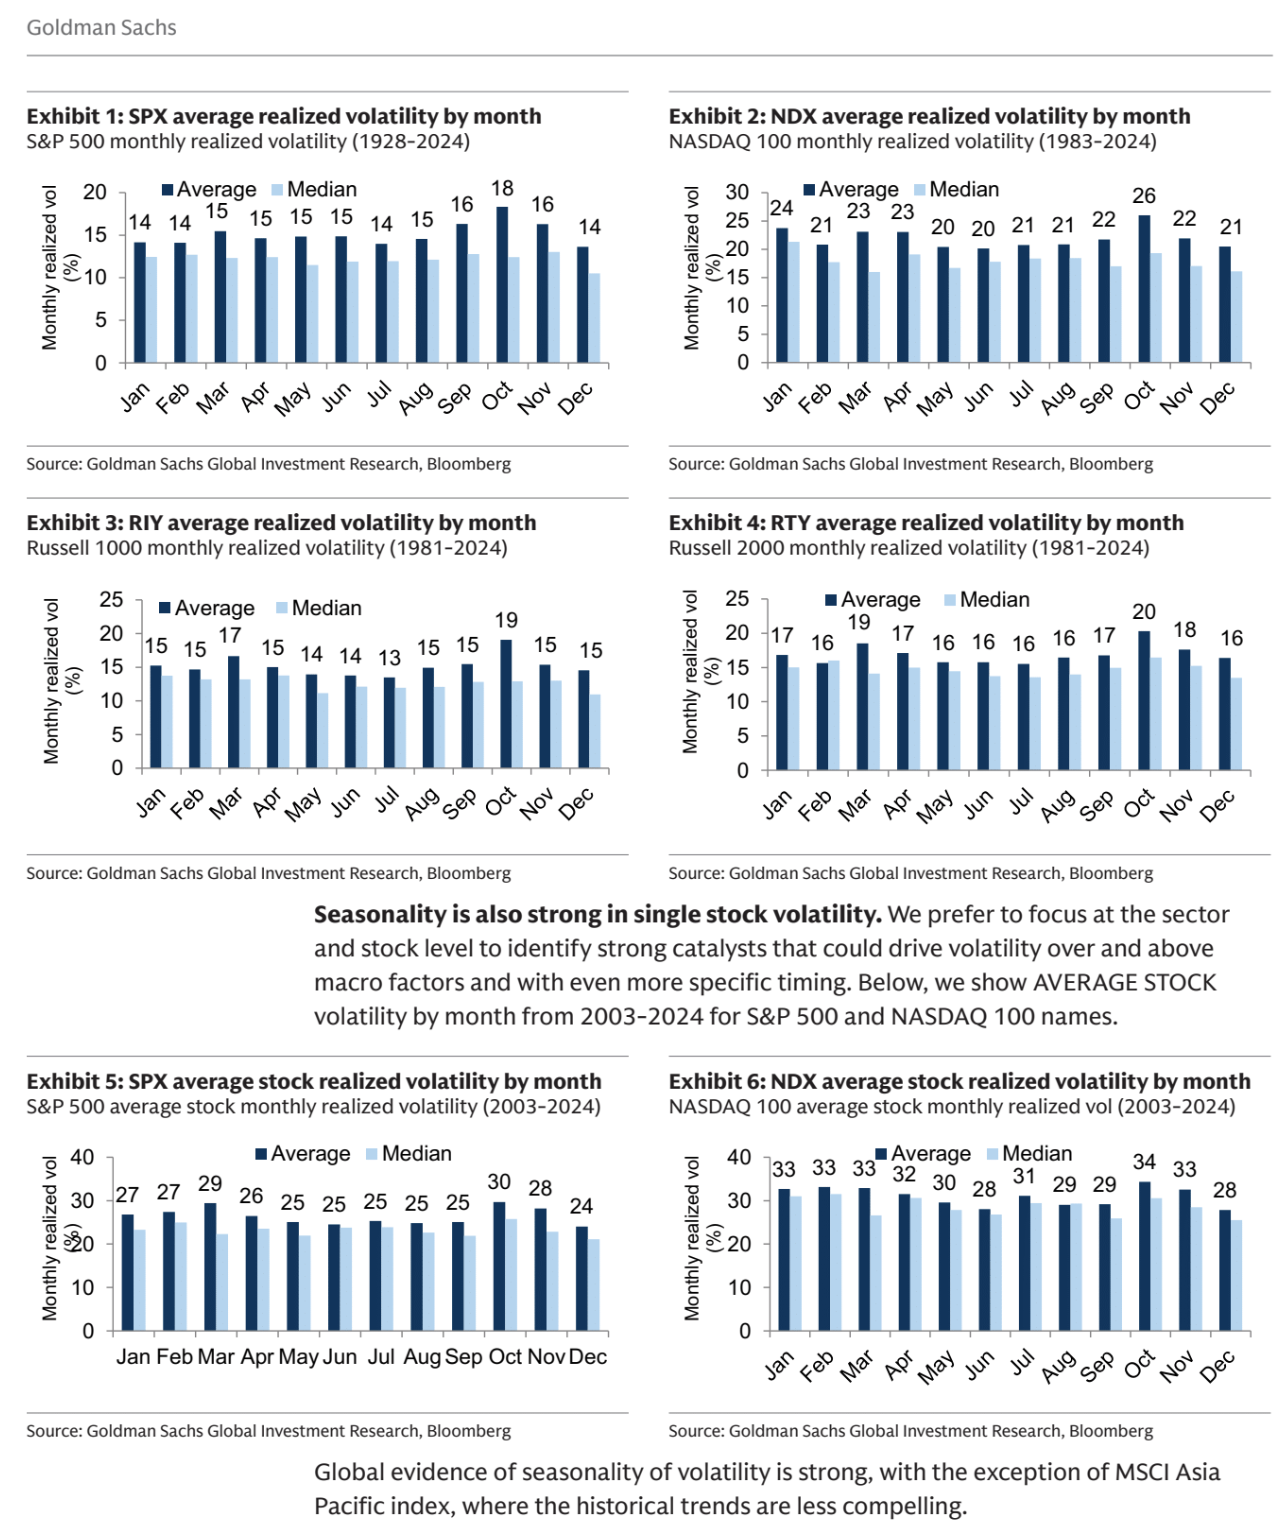
October historically experiences volatility that is 25% greater than that of other months. From 1928 onward, the average realized volatility for the SPX in October has been 18, compared to 15 for other months. This pattern of elevated volatility in October has been observed across major indexes and sectors over the last 30 years, including NDX, R1000, R2000, and International indexes. In recent decades, October's volatility has been especially pronounced, with notable spikes occurring in 1997, 2002, 2008, 2011, and 2022.
The reasons behind October's heightened volatility are likely more than coincidental. It appears to be a pivotal time for many investors and companies who are concerned with year-end performance. These pressures result in increased trading volumes and volatility as participants scrutinize earnings reports, analyst events, and management forecasts for the upcoming year.
There is a clear trend of rising volatility from August to October across major indexes. Our analysis includes SPX data over the past 97 years, NDX data from the past 42 years, and Russell 1000/2000 data spanning 44 years. Some of the most volatile months in recent decades have occurred in October, resulting in an average realized volatility that exceeds that of other months by over 25%, even though the median levels remain comparable. Note: The periods analyzed reflect the maximum available data for each respective index.
Disclaimer: The material provided is for information purposes only and should not be considered as investment advice. The views, information, or opinions expressed in the text belong solely to the author, and not to the author’s employer, organization, committee or other group or individual or company.
Past performance is not indicative of future results.
High Risk Warning: CFDs are complex instruments and come with a high risk of losing money rapidly due to leverage. 71% and 74% of retail investor accounts lose money when trading CFDs with Tickmill UK Ltd and Tickmill Europe Ltd respectively. You should consider whether you understand how CFDs work and whether you can afford to take the high risk of losing your money.
Futures and Options: Trading futures and options on margin carries a high degree of risk and may result in losses exceeding your initial investment. These products are not suitable for all investors. Ensure you fully understand the risks and take appropriate care to manage your risk.
Patrick has been involved in the financial markets for well over a decade as a self-educated professional trader and money manager. Flitting between the roles of market commentator, analyst and mentor, Patrick has improved the technical skills and psychological stance of literally hundreds of traders – coaching them to become savvy market operators!