FOMO Friday: NZDJPY Turning Higher Again

Well, here we are yet again, into the half of the year where the Friday’s seem to roll around quicker and quicker. Looking back across the weekly action and talking with traders about the winners and losers and, most importantly, missed opportunities, it seems the big move traders are focus on is the reversal higher in NZDJPY. The pair has seen a near 2% rally off the weekly lows. So as ever, if you caught the move, well done! And if you missed it? Better luck next week. Now, let’s take a look at what happened and why it was a great trade.
What Caused The Move?
This week’s FX move wasn’t simply a case of stronger currency versus weakest currency. While NZD was in fact the bets performer this week, JPY was above AUD and EUR which were the weakest currencies. Instead, this week it was a case of data release and themes.
Better Data Boosts NZD
NZD was bolstered this week by a much stronger than expected set of employment release. The unemployment rate was seen falling back to 4% last month from the prior month’s 4.6% reading and well below the 4.4% forecast. Similarly, the quarterly employment change was seen rising to 1% from the prior month’s 0.6% and, again, well above the 0.7% forecast.
Hawkish RBNZ Expectations
On the back of the data, expectations for an RBNZ rate hike in August have spike dramatically. The market was already gearing up its hawkish expectations on the back of the RBNZ last month outlining that it would end QE as of September. Now, with data steaming ahead, the market is firmly looking for a rate hike in the coming month.
Monetary Policy Divergence
On the other hand, the BOJ continues to reaffirm its commitment to maintaining an easing presence, creating strong monetary policy divergence between itself and the RBNZ. With this dynamic only likely to become more entrenched over the coming months, there is plenty of room for further upside. With that in mind, let’s take a look at the technical picture.
Technical Views
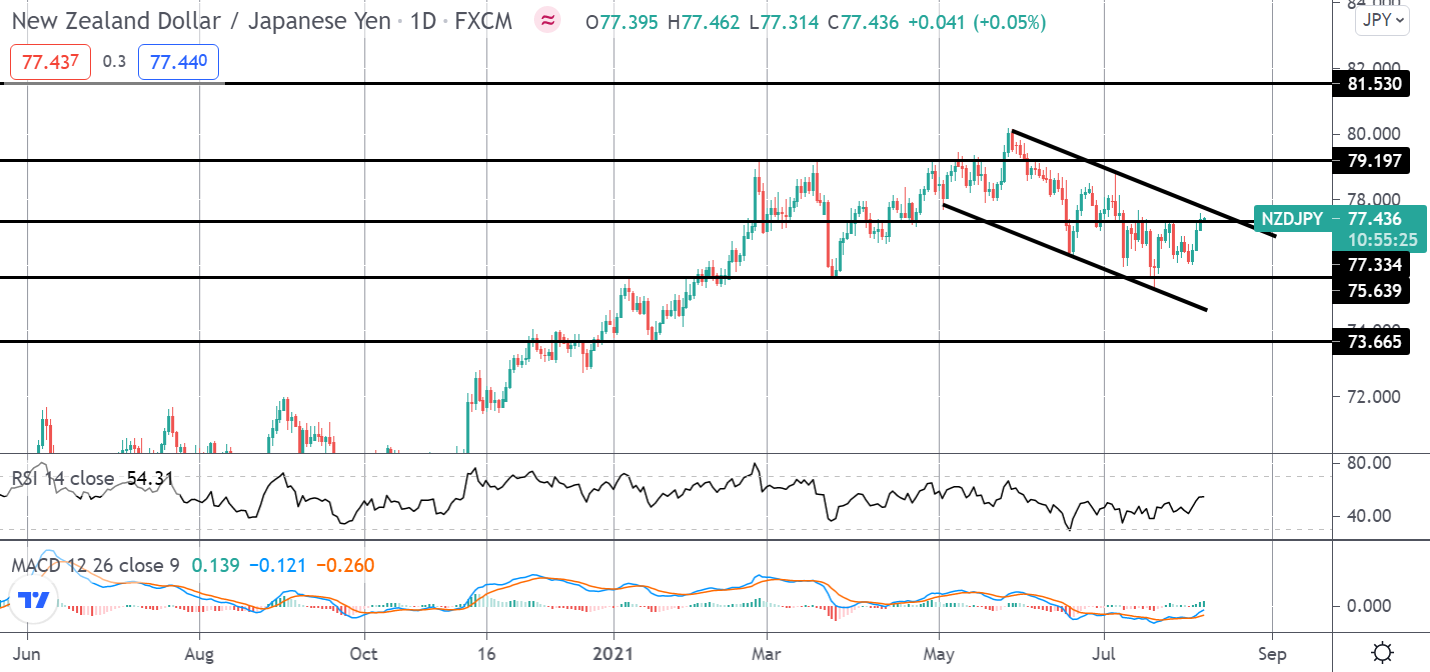
NZDJPY
The current downside price action in NZDJPY can be viewed as a corrective bull-flag pattern within the longer-term bull trend, suggesting room for a continuation higher. Price is currently testing the 77.33 resistance channel top. With MACD and RSI bullish, a break above this area will put the focus on a move up to the 79.19 level next.
Disclaimer: The material provided is for information purposes only and should not be considered as investment advice. The views, information, or opinions expressed in the text belong solely to the author, and not to the author’s employer, organization, committee or other group or individual or company.
Past performance is not indicative of future results.
High Risk Warning: CFDs are complex instruments and come with a high risk of losing money rapidly due to leverage. 71% and 74% of retail investor accounts lose money when trading CFDs with Tickmill UK Ltd and Tickmill Europe Ltd respectively. You should consider whether you understand how CFDs work and whether you can afford to take the high risk of losing your money.
Futures and Options: Trading futures and options on margin carries a high degree of risk and may result in losses exceeding your initial investment. These products are not suitable for all investors. Ensure you fully understand the risks and take appropriate care to manage your risk.
With 10 years of experience as a private trader and professional market analyst under his belt, James has carved out an impressive industry reputation. Able to both dissect and explain the key fundamental developments in the market, he communicates their importance and relevance in a succinct and straight forward manner.